

The NAV your LPs judge you on
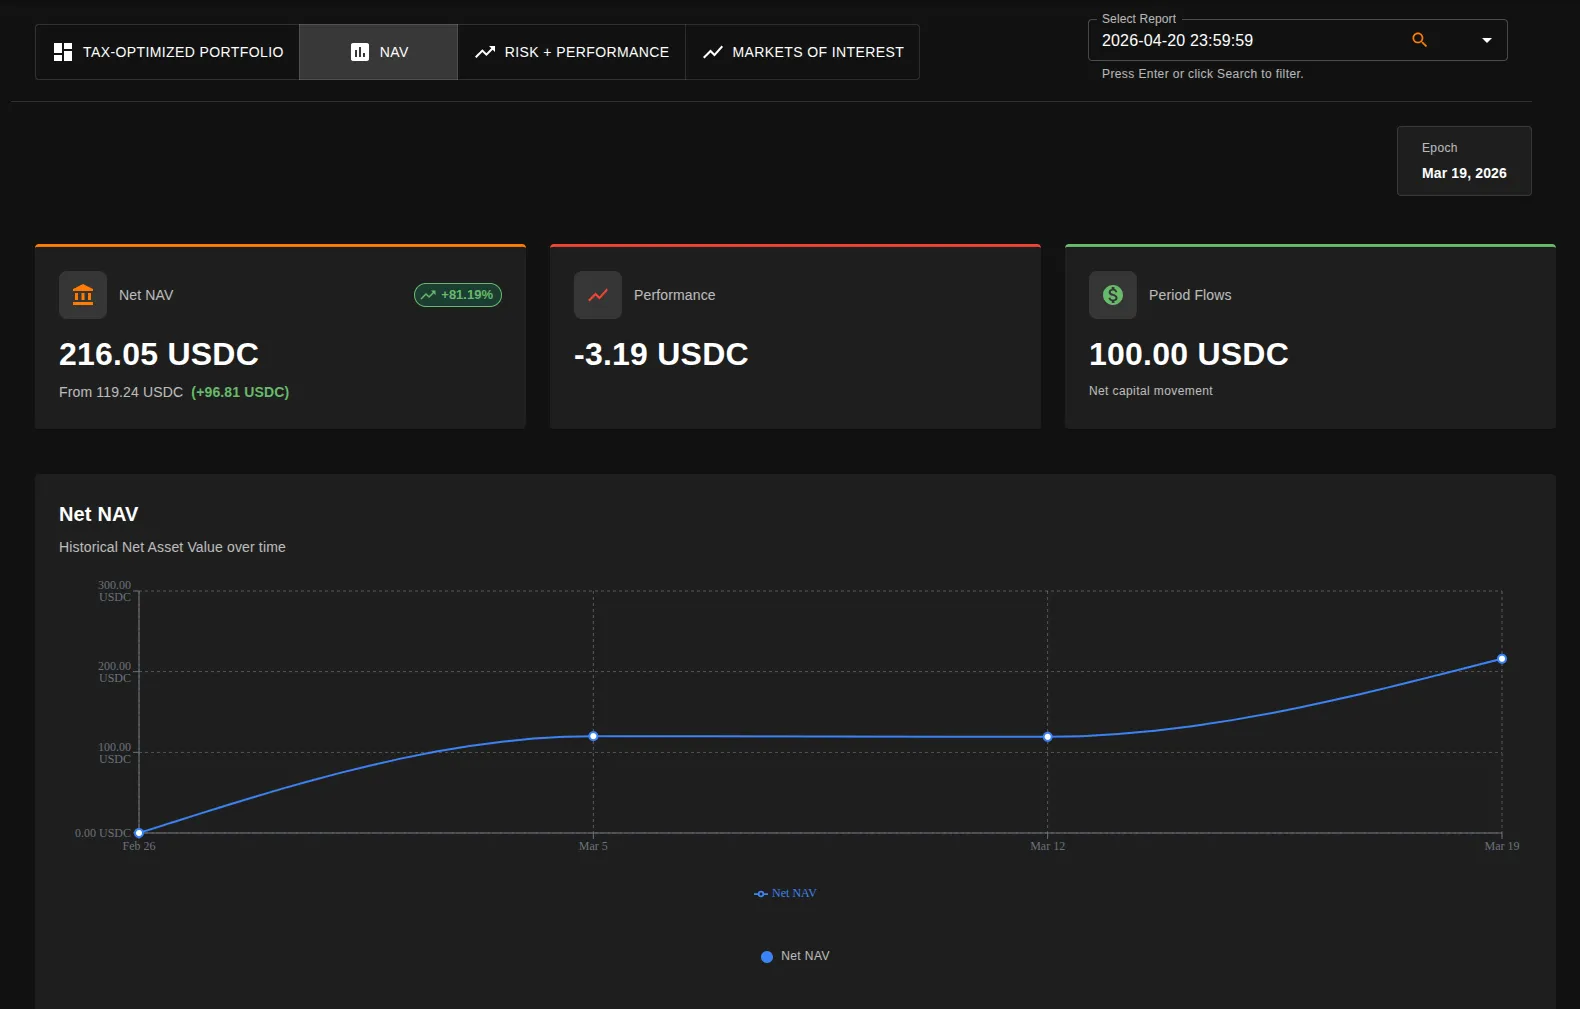
What your investors and your auditor actually get
A NAV that walks
The movement from one period to the next decomposes into flows, income, realised gains and the change in unrealised, and it ties out. If it does not tie out it is not a NAV, it is an assertion, and the person who finds that out is the one paid to disbelieve you.
Fees you can defend line by line
Management, administration and incentive fees, with the incentive fee struck against a high-water mark, so performance is charged on new gains above the prior peak and not on the same gains twice. The mark moves with capital that flowed in, too, so a big subscription cannot quietly manufacture a performance fee nobody earned.
One number, one set of books
This is the same ledger behind your portfolio composition and your financial statements. Three reports telling one story, rather than three that have to be reconciled to each other the week before an audit.
Coverage that reaches your whole book
We ship parsers for a wide range of protocols and build new ones quickly, so a new chain or protocol is typically supported in days. Where a position sits in something bespoke or unsupported, a custom parser is built for it and that protocol is booked consistently from then on, so the position lands in the NAV like any other.
You get the numbers as often as daily: on a dashboard, by API, as files, or published onchain.
See it running
Section titled “See it running”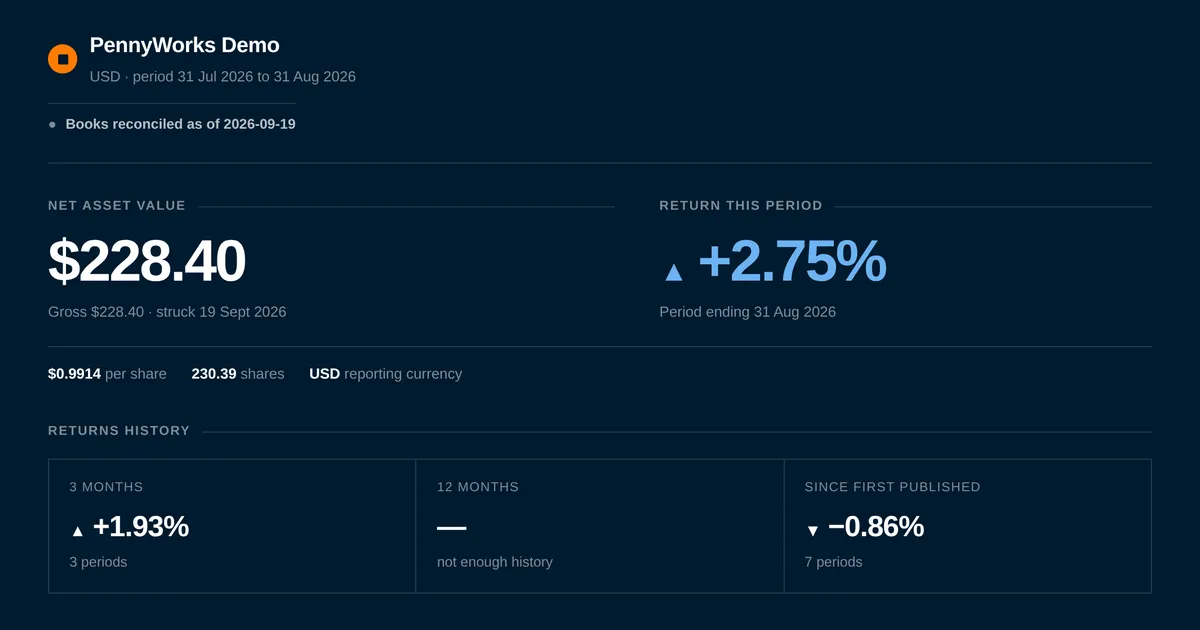
There is a public NAV fact sheet at nav.pennyworks.com. What it shows is our own demo account, running on the same production system your books would run on. Your LP can open it from the link, and so can their auditor. Every figure on it is built from the transactions underneath.
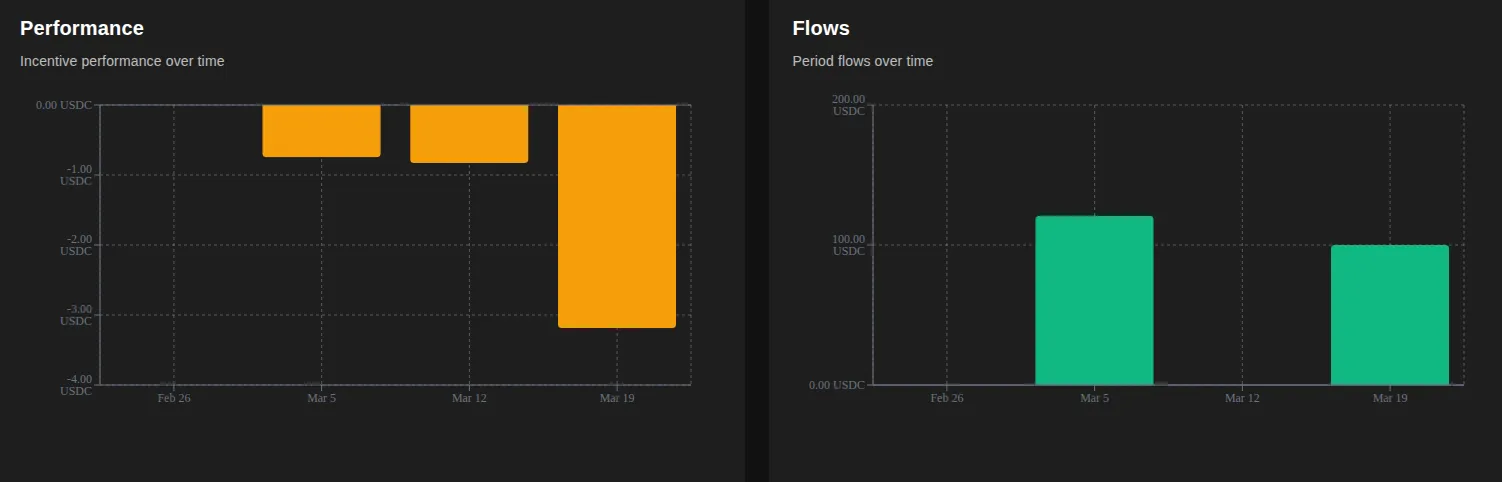
Complete NAV and financial statements for your fund
Talk to us