

Portfolio Analytics
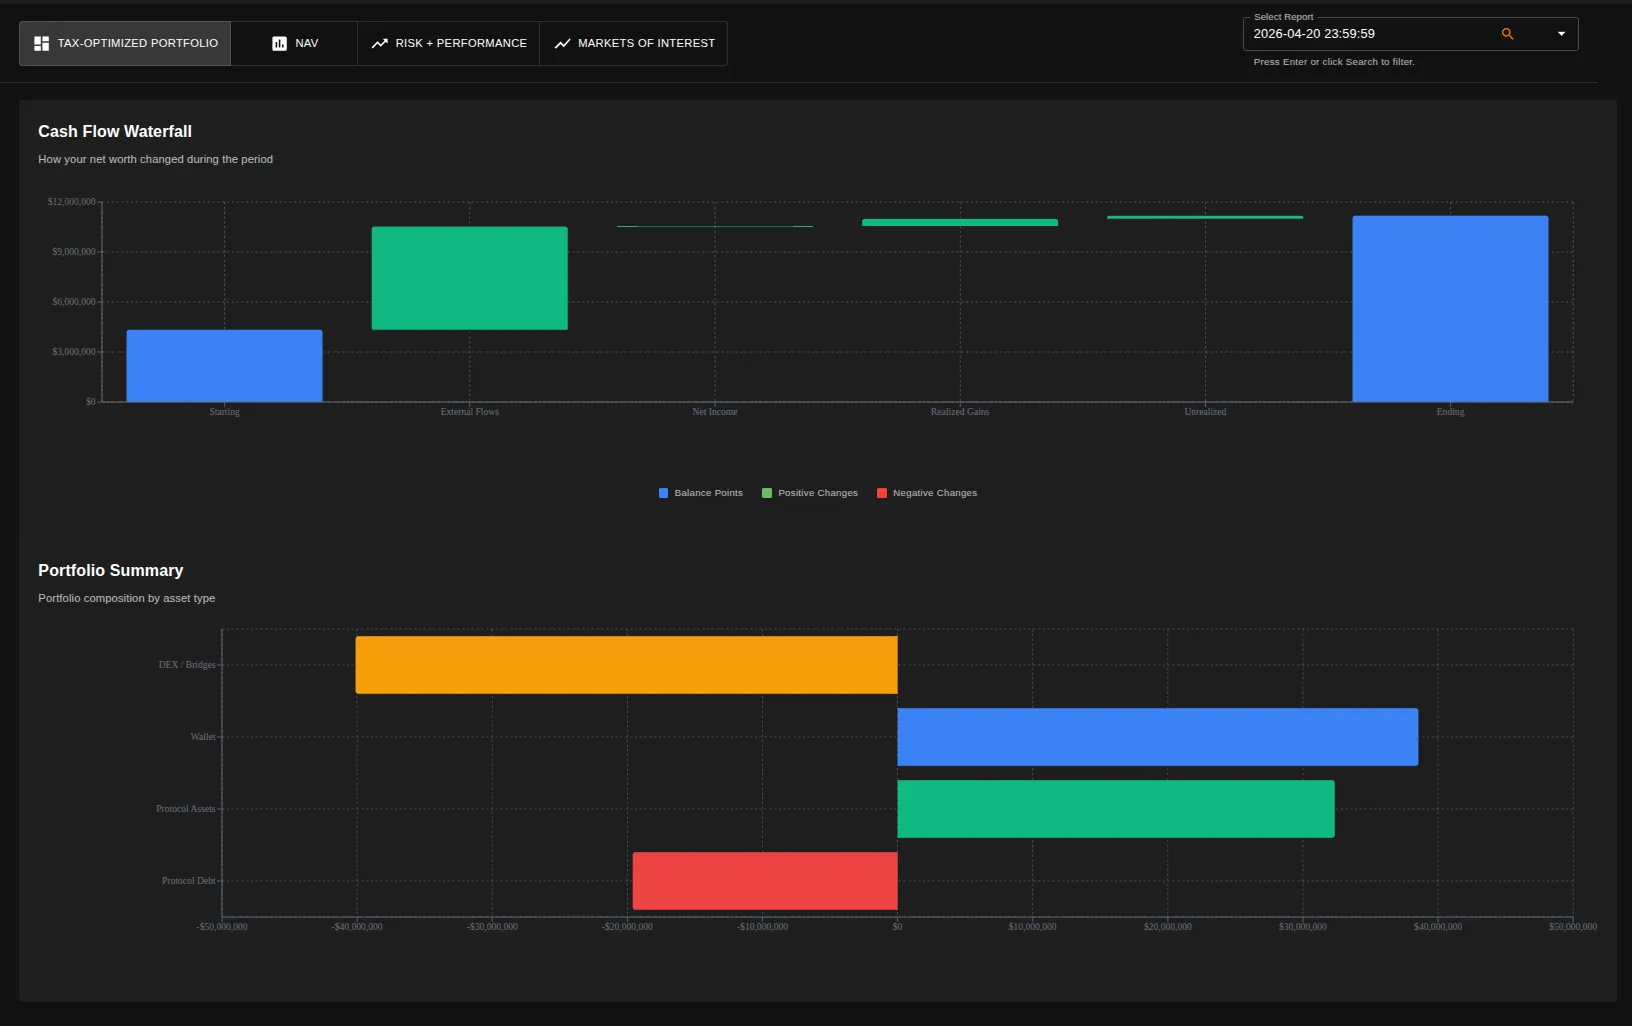
Portfolio
Every position at the close, ranked by value, with the movement in net worth attributed to external flows, net income, realised gains and the change in unrealised value. Four causes, separated, so the answer to why the number moved is a sentence rather than an afternoon. Money you wired in is held apart from money the strategy made.
Learn more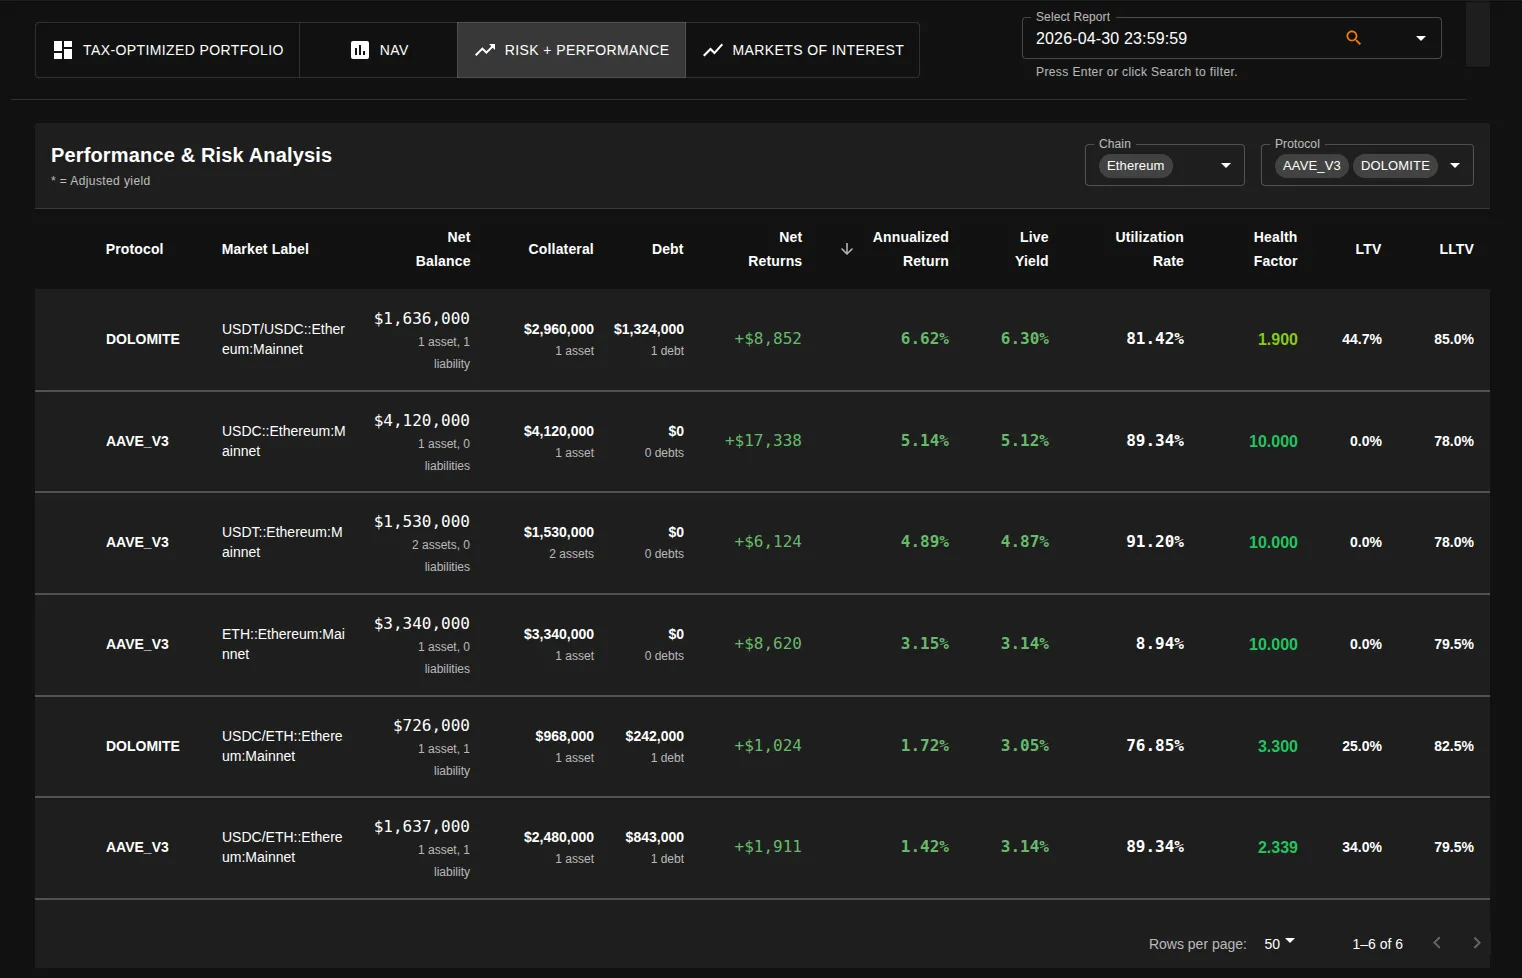
Risk and performance
What every position earns, on the same row as how close it is to being taken off you. Total debt over total collateral across the whole book rather than protocol by protocol, a running count of the positions sitting under a health factor of 1.1, and every position graded from critical, below 1.0, up to very safe.
Learn more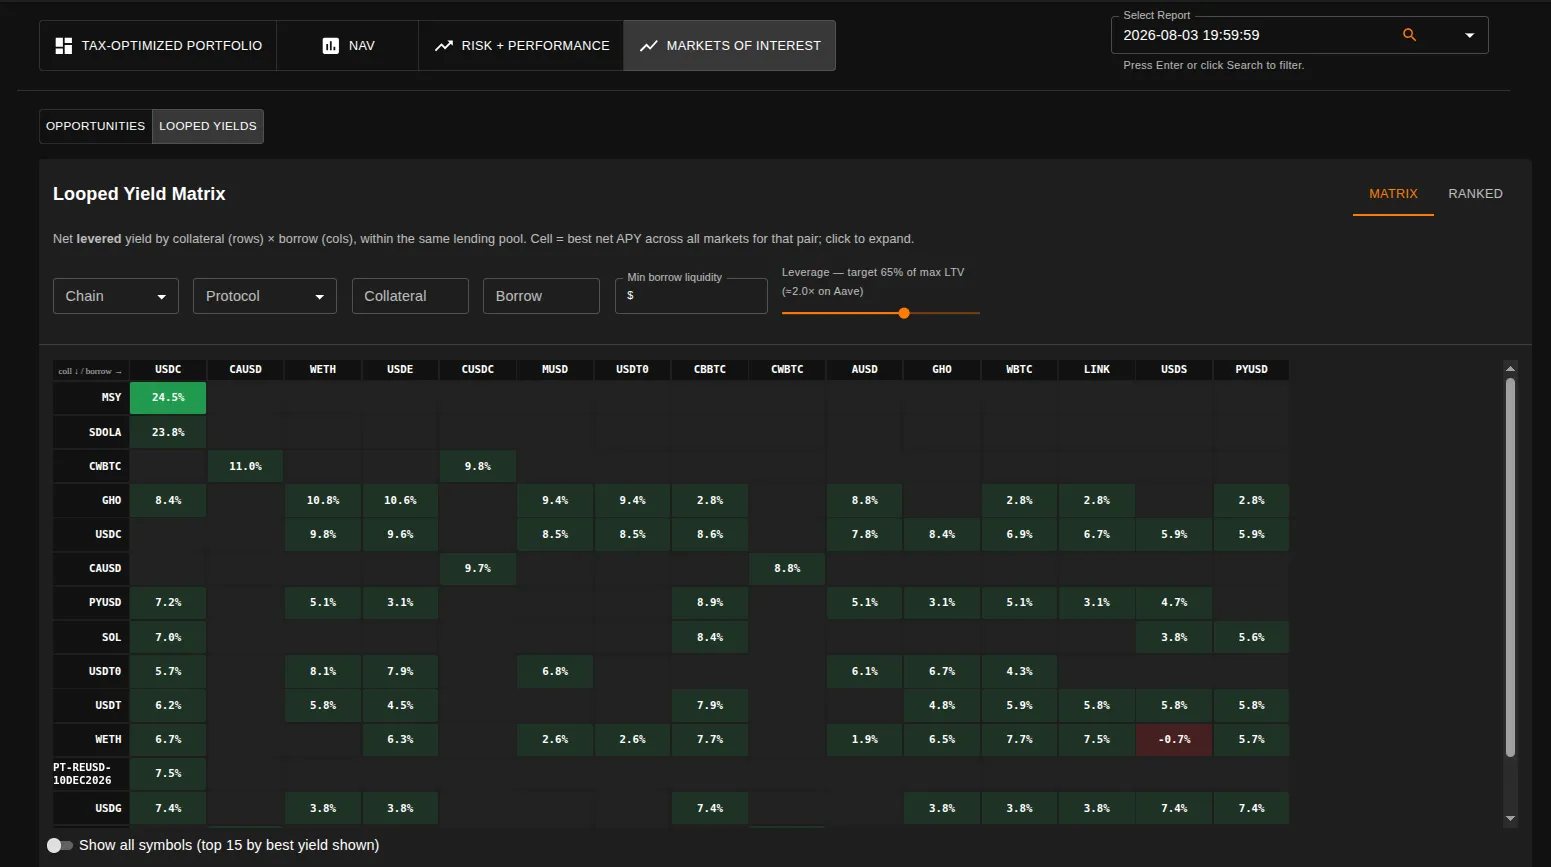
DeFi Markets
External lending markets, narrowed to the part you care about. Total value locked, available liquidity, utilisation rate, borrow APY and deposit APY, all filterable and sortable. Net levered yield for every collateral against every borrow asset as a matrix, modelled against each protocol's own maximum LTV, with a safety buffer you set. Where the other two views report on what you hold, this one is for what you might hold next.
Learn moreThis is a research tool. The matrix models what a market is offering right now, on current rates, at a leverage you choose. It is not a forecast, and it is not advice.
Get visibility into your fund performance
Talk to us