

12 Numbers That Show U.S. Families Are Getting Richer

Introduction
Section titled “Introduction”Pew Research Center performed an in-depth analysis of U.S. government data, and the results were telling.
Since 1971, the economic status of middle-income Americans has changed dramatically. In 1971, 61% of Americans were considered middle class. By 2021, that figure had fallen to 50%—a decline of 11 percentage points over the past 50 years.
So, where did that 11% go?
During that period, the middle class gradually shifted in both directions. Some individuals moved into the lower-income tier (+4%), while others climbed into the upper-income tier (+7%). While changes in earnings are expected over time, the upper-income tier grew much faster, widening the gap between lower- and middle-income earners and their upper-income counterparts.
Where Are We Seeing the Biggest Changes?
Section titled “Where Are We Seeing the Biggest Changes?”Over just 50 years:
- Lower-income household income grew by 45%
- Middle-income household income grew by 50%
- Upper-income household income grew by 69%
As a result, income gaps widened significantly.
In 2020:
- The median income of upper-income households was 7.3× that of lower-income households, up from 6.3× in 1970.
- The median income of upper-income households was 2.4× that of middle-income households, up from 2.2× in 1970.
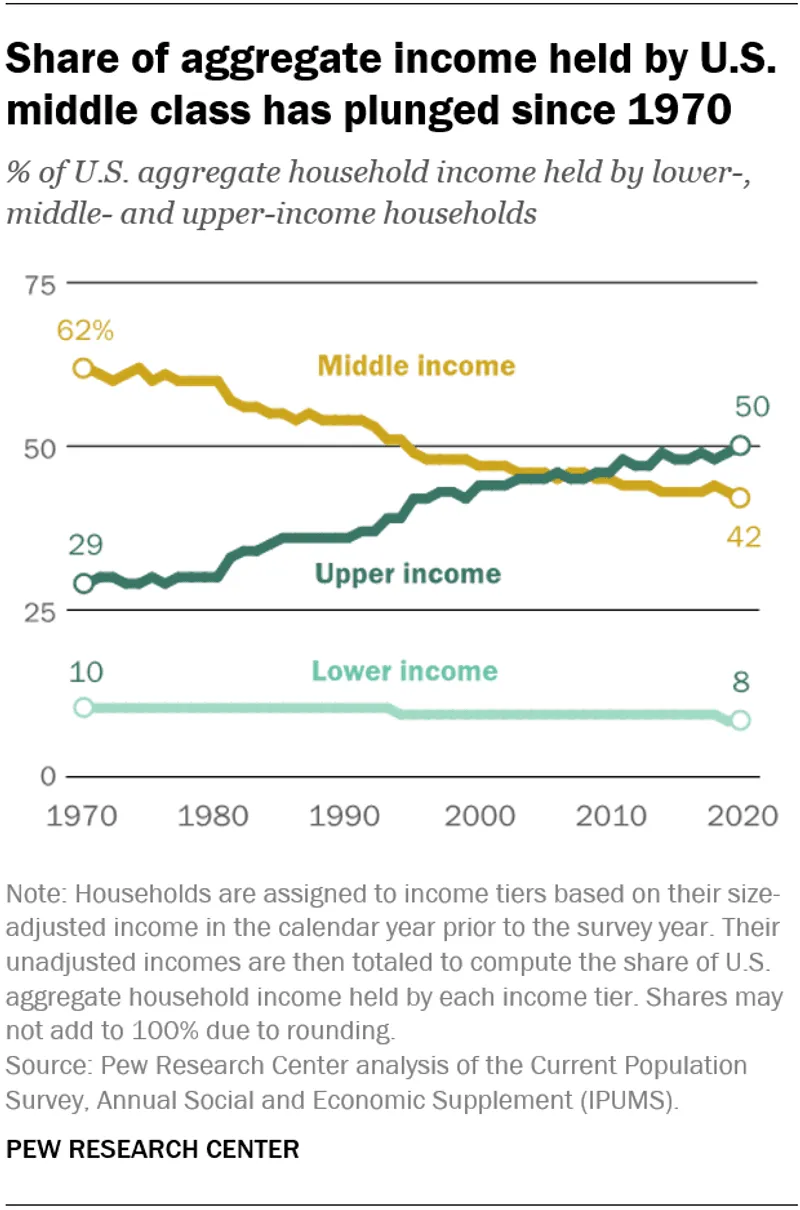
The Middle Class’s Shrinking Share
Section titled “The Middle Class’s Shrinking Share”Since 1970, the middle class has steadily lost its share of aggregate U.S. income.
- In 1970, middle-income households earned 62% of aggregate income.
- By 2020, that figure had fallen to 42%.
Meanwhile, upper-income households increased their share from 29% in 1970 to 50% in 2020.
Pew Research Center notes:
“The share of U.S. aggregate income held by lower-income households edged down from 10% to 8% over these five decades, even though the proportion of adults living in lower-income households increased over this period.”
The report also highlights:
“Older Americans and Black adults made the greatest progress up the income ladder from 1971 to 2021.”
Among all adults:
- The share in the upper-income tier increased from 14% to 21%.
- The share in the lower-income tier increased from 25% to 29%.
Overall, this represents a net gain of three percentage points in income status.
Older Americans (65+) made especially notable progress. They increased their representation in the upper-income tier while simultaneously reducing their share in the lower-income tier, resulting in a 25-point improvement between 1971 and 2021.
What Are Some Contributing Factors?
Section titled “What Are Some Contributing Factors?”Growth in household income is believed to be influenced by several factors, including:
- Higher educational attainment
- Greater labor force participation
- Longer working careers
- Government assistance programs such as Social Security
Despite these gains, more than one in three Americans aged 65 or older still fell into the lower-income bracket in 2021, making seniors one of the groups most likely to have low incomes.
The good news is that this has improved considerably over time:
- In 1971, 54% of seniors were in the lower-income tier.
- By 2021, that number had fallen to 37%.
During the same period:
- The middle-income share among seniors increased from 39% to 47%.
- The upper-income share increased from 7% to 16%.
While seniors still trail the general population economically, substantial progress has been made over the past five decades.
More Interesting Findings
Section titled “More Interesting Findings”Adults aged 65 and older remain the only age group in which more than one-third are in lower-income households. They are also less likely than adults aged 30–64 to be in the upper-income tier.
Education continues to be one of the strongest predictors of income.
Among adults with some college education or less, the share in the lower-income tier increased significantly over time.
At the same time, educational attainment rose substantially:
- In 1971, only 11% of adults aged 25+ had completed at least four years of college.
- By 2021, that figure had grown to 38%.
The payoff is substantial:
- 39% of college graduates reached the upper-income tier.
- Only 16% of adults without a bachelor’s degree did.
Since the 1970s, adults with at least a bachelor’s degree have steadily increased their representation in the upper-income tier, while those without a bachelor’s degree have remained flat or declined, widening the educational income gap.
By 2021:
- Roughly half of adults with either some college education or only a high school diploma remained middle class.
- However, these groups experienced significant declines in middle-class representation and corresponding increases in lower-income status.
Approximately 39% of adults with only a high school diploma were in the lower-income tier in 2021—about double the share in 1971.
Marriage and Income
Section titled “Marriage and Income”The data also suggests a relationship between education, marriage, and income.
Individuals with higher levels of education are generally more likely to marry, and married households tend to have higher incomes.
As a result:
- Married households are more likely to fall into the upper-income tier.
- Unmarried individuals are more likely to be in the lower-income tier.
Households with two earners naturally have a greater chance of reaching higher income levels.
One particularly interesting trend is that, over the past 50 years, married men and women experienced little change in lower-income representation but saw a 13-percentage-point increase in the upper-income tier.
Among unmarried adults:
- Unmarried women remained more likely to be in the lower-income tier.
- Unmarried men became more likely to fall into the lower-income tier while becoming less likely to remain middle class.
Another Gap Worth Noting
Section titled “Another Gap Worth Noting”Pew Research Center also found:
“Adults in households with more than one earner fare much better economically than adults in households with only one earner.”
In 2021:
- 20% of adults in multi-earner households were lower income.
- 53% of adults in single-earner households were lower income.
Adults in multi-earner households were also more than twice as likely to belong to the upper-income tier.
The report further notes:
“The relative economic status of men and women has changed little from 1971 to 2021.”
Both men and women experienced similar increases in both the lower- and upper-income tiers while seeing declines in middle-class representation.
Women, however, remained more likely than men to live in lower-income households in 2021 (31% vs. 26%).
Married men, married women, and Black adults all experienced net gains of roughly 12–14 percentage points over the study period.
Nevertheless, Black adults—along with adults aged 65 and older—remained more likely than many other demographic groups to fall into the lower-income category.
Pew Research Center further explains:
“Despite progress, Black and Hispanic adults trail behind other groups in their economic status.”
Approximately:
- 40% of Black adults were lower income in 2021.
- 40% of Hispanic adults were lower income.
- 24% of White adults were lower income.
- 22% of Asian adults were lower income.
Black adults were also the only major racial or ethnic group whose middle-class share remained roughly unchanged, at 47% in both 1971 and 2021.
Meanwhile:
- 52% of White adults remained middle class in 2021 (down from 63%).
- Only about 10% of Black and Hispanic adults were upper income.
- More than 25% of White and Asian adults reached the upper-income tier.
The report also notes that every age group other than seniors experienced:
- A larger lower-income share.
- A smaller middle-income share.
- A larger upper-income share.
For example, among adults aged 30–44, the upper-income share nearly doubled—from 12% in 1971 to 21% in 2021.
What Does This Tell Us?
Section titled “What Does This Tell Us?”The income divide is expanding—that much is clear.
The sooner you make forward-thinking, diversified decisions about managing your wealth, the more likely you are to find yourself on the right side of that divide in the years ahead.